
New Debao people pursue the concept of high quality and technology leading.
By changing the working mode with intelligent paper cup machine to make the operation more and more simple.
A plant manager in Malaysia called at 2 AM. His high-speed line had stopped — again. Paper jam at the feeding section. Third time that week. Output was running at 62% of the target. The owner was furious.
He wasn’t alone. In a 2024 survey of 45 cup production facilities across Southeast Asia, the average sustained OEE was only 68%. Nearly one-third of planned output vanished into bottlenecks.
The frustrating part? Most bottlenecks aren’t mysterious. They follow predictable patterns with proven fixes. This guide walks through five of the most common slowdowns in high-volume cup lines — and exactly how to solve them.
What it looks like: The line runs fine for 20–30 minutes, then a misfeed stops production. You clear it, restart, and 15 minutes later, it happens again. Your effective speed is 30–40% below the machine’s rating.
Root cause analysis:
Paper moisture content too high (above 8%) or too low (below 4%)
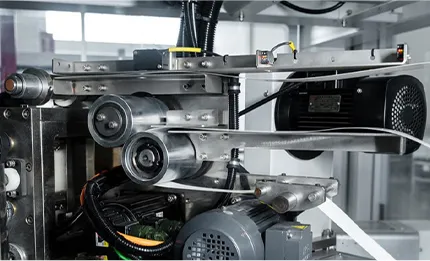
Worn feed rollers or incorrect roller pressure
Static electricity causes sheets to stick together
Paper roll edge damage from rough handling
Real-world diagnostic: A Thai packaging plant was losing 18% of production time to paper jams. After logging each stoppage, they discovered 80% of jams occurred within the first hour of a new roll, while operators were adjusting feed tension manually. Installing automatic tension control reduced jam frequency by 73%.
Solutions:
| Root Cause | Fix | Cost | Implementation time |
|---|---|---|---|
| Variable paper moisture | Install online moisture meter + preconditioning storage | $3k–8k | 2–4 weeks |
| Worn rollers | Replace feed rollers every 2,000 operating hours (scheduled) | $500–1k | 1 hour |
| Static buildup | Install active static eliminator bars at the feed | $800–2k | 1 day |
| Roll edge damage | Train forklift operators; use padded roll clamps | Training costs only | Immediate |
Prevention measure: Log every jam with time, roll ID, and operator. After 50 jams, you’ll see the pattern. Most plants discover that 60–80% of jams come from 20% of paper rolls (poor storage or shipping damage).
What it looks like: Cups pass the leak test at the start of the shift. Two hours later, random cups fail at the bottom seam. Operators increase the temperature. Now the side seams start burning. Scrap rate climbs from 2% to 9%.
Root cause analysis: Temperature drift caused by:
Heater band aging (resistance changes over time)
Inconsistent paper coating thickness (PE or PLA variation)
Air drafts cool the forming station
Thermocouple placement that doesn’t reflect the actual sealing surface temperature
Engineering data: A study of 12 high-volume lines (source: industry maintenance logs, 2023) found that heater band resistance drifted by up to 22% over 3,000 operating hours. Most plants only replaced bands after failure, costing an average of 4.7 hours of downtime per event.
Solutions:
Upgrade to PID controllers (Proportional-Integral-Derivative) — they maintain temperature within ±2°C instead of ±8°C for basic on/off controls. Retrofit cost: $2k–5k per heater zone.
Install redundant thermocouples — two sensors per heater. When they disagree by more than 5°C, the system alerts you before cups fail. Cost: $300–600 per zone.
Create a heater replacement schedule — every 2,500 operating hours, regardless of appearance. A Malaysian plant adopted this and reduced sealing-related scrap from 7.2% to 3.1% in six months.
Quick fix while you wait for upgrades: Measure heater resistance monthly with a multimeter. Log values. When resistance changes by more than 15% from baseline, schedule replacement during the next planned downtime.
What it looks like: You planned for 12 hours of production today. But between three changeovers (8oz to 12oz to 16oz), you lost 2.5 hours. Total output: 38,000 cups instead of 52,000.
The math problem: A line running 180 CPM looks great on paper. But if changeover takes 45 minutes and you do four changeovers per shift, you lose three hours daily. Effective speed drops to 135 CPM.
Root cause: Mechanical changeover on traditional lines requires repositioning cams, adjusting paper guides, changing forming mandrels, and recalibrating heaters — often by feel rather than by measurement.
Real-world before/after: A Vietnamese converter tracked changeover times across two identical lines. Line A (mechanical) averaged 38 minutes per change. Line B (servo-assisted with recipe storage) averaged 12 minutes. Annualized impact for 1,000 changeovers: 433 hours lost vs 200 hours lost — a gain of 233 production hours worth roughly $35,000 in output.
Solutions ranked by impact:
Low-cost (0–$2k): Create detailed changeover checklists with torque values and photos. Train all operators the same way. Time each changeover and post results. This alone cut changeover time by 22% at one Indian plant.
Mid-cost ($5k–15k): Add mechanical position indicators (scales or dials) to adjustable stations. Operators can record optimal settings for each cup size. Repeatability improves from ±3mm to ±0.5mm.
High-cost ($25k–60k): Retrofit servo drives on critical stations (bottom knurling, curl height). Add recipe storage. Push-button changeover. Payback typically 8–14 months for plants with 5+ changeovers weekly.
The mistake to avoid: Don’t invest in high-speed automation until you’ve optimized your manual changeover process. Poor procedures will still cause delays — just faster delays.
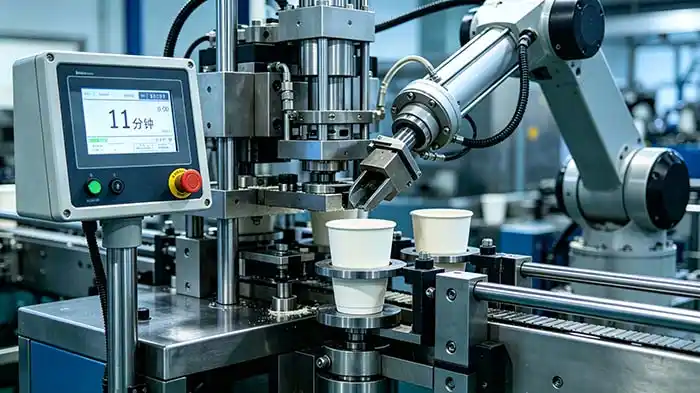
What it looks like: The forming line runs beautifully at 160 CPM. But cups pile up at the discharge. Operators scramble to pack them into cartons. Every few minutes, the line stops because the stacking table is full.
Root cause: The packaging department can’t keep up. Your cup line is faster than your manual packing station.
Real example from a Mexican plant: Their line ran at 180 CPM. Three packers could handle 120 CPM comfortably. Beyond that, cups started falling off the table. The line automatically slowed to 115 CPM — losing 36% of potential output.
Solutions:
Automatic stacker/counter — receives cups from the discharge, counts batches, and ejects stacks onto a conveyor. Cost: $8k–20k. Removes the need for one packer instantly.
Inline sleeving — automatically groups cups into sleeves (e.g., 25 or 50 cups) and heat-shrinks or tapes them. Cost: $15k–40k. Two packers can handle 200 CPM with this system.
Conveyor to automatic palletizer — for very high volumes (250+ CPM), integrate with robotic palletizing. Cost: $80k–200k. Payback under 12 months for 24/5 operations.
Stopgap while you budget: Reconfigure the packing station layout. Move cup bins closer. Add a second discharge chute to split the output between two packers. This costs under $1,000 and can lift effective speed by 30–40%.
What it looks like: Cups look fine from the side. But when you press on the bottom, it feels soft. Some cups leak after 15 minutes. Reject rate spikes unpredictably.
Root cause: The bottom knurling station (which bonds the bottom disc to the cup wall) is sensitive to three variables:
Paperboard stiffness variation
Heater temperature drift (see Bottleneck #2)
Worn knurling rollers
Data from a German contract packer: They traced 64% of leak complaints to bottom seal issues. After replacing knurling rollers every 1.5 million cups (instead of “when they look worn”), leaks dropped by 71%.
Practical fix schedule:
| Component | Wear indicator | Replacement interval |
|---|---|---|
| Knurling rollers | Visible flattening of the knurl pattern | Every 1.5–2M cups |
| Bottom heater band | Resistance change >15% | Every 2,500 hours |
| Forming the mandrel (bottom section) | Scoring or scratches | Every 5–8M cups |
Quick diagnostic: Run 100 cups, then cut 10 randomly across the run. Examine the bottom seal cross-section under magnification. Look for incomplete fusion, voids, or scorching. This 15-minute check once per shift catches problems before they reach customers.
| Bottleneck | First-step fix (under $2k) | Full solution (investment) | Expected OEE gain |
|---|---|---|---|
| Paper feeding | Train forklift operators; log jams | Auto tension + static eliminators | +8–12% |
| Heating inconsistency | Monthly resistance checks; PID tune-up | PID controllers + redundant TC | +5–10% |
| Slow changeovers | Detailed checklists; position scales | Servo retrofits with recipes | +10–20% |
| Output stacking | Reconfigure packing layout | Auto stacker + sleeving | +10–15% |
| Bottom curl issues | Scheduled roller replacement | Quality monitoring system | +4–8% |
The 80/20 rule: Fixing just the top two bottlenecks in your plant typically delivers 60–70% of total potential OEE improvement. Start with the one that stops your line most frequently — you can measure this by reviewing your downtime log for the past month.
Sometimes, despite fixing everything above, your line still underperforms. That’s when you need to look at the original equipment design:
Undersized servo drives that overheat during peak demand
Poor access for cleaning (flour or paper dust buildup causes jams)
Lack of diagnostic data — no way to know why the line stopped
One European plant spent six months chasing random jams. Eventually, they installed a vibration sensor on the main bearing. Data showed an 11Hz resonance that only appeared at 172+ CPM. The line’s frame had a design flaw above 170 CPM. They slowed to 168 CPM — and jams disappeared. Output actually increased.
The lesson: Sometimes a bottleneck isn’t your fault — it’s in the iron. That’s when switching to a better-designed platform is cheaper than endless Band-Aids.
No production line runs perfectly every hour. But most high-volume cup lines are losing 20–35% of their potential output to preventable bottlenecks.
Start with the one that costs you the most downtime today. Apply the low-cost fix. Measure the result. Then move to the next.
You don’t need a new line to improve OEE. You need systematic problem-solving and the discipline to replace wear parts before they fail.
If you’re tired of fighting the same bottlenecks and want to explore cup-forming systems designed for maintainability, data visibility, and rapid changeover, Newdebao builds equipment with documented OEE performance in real production environments.
Review technical specifications and request a bottleneck assessment checklist for your line.
[View Newdebao’s high-performance cup forming systems]
Southeast Asia plant survey – 45 facilities, Q2 2024 (industry association data, anonymized)
Thai packaging plant jam reduction data – internal maintenance logs, 2023
Heater resistance drift study – 12 lines, 2023–2024 (anonymous manufacturing consortium)
Vietnamese converter changeover time comparison – site audit, 2024
German contract packer knurling roller data – quality reports, 2024
Mexican plant packing bottleneck – operational assessment, 2023
European vibration analysis case – engineering report (company name redacted)
All images are for illustrative purposes only
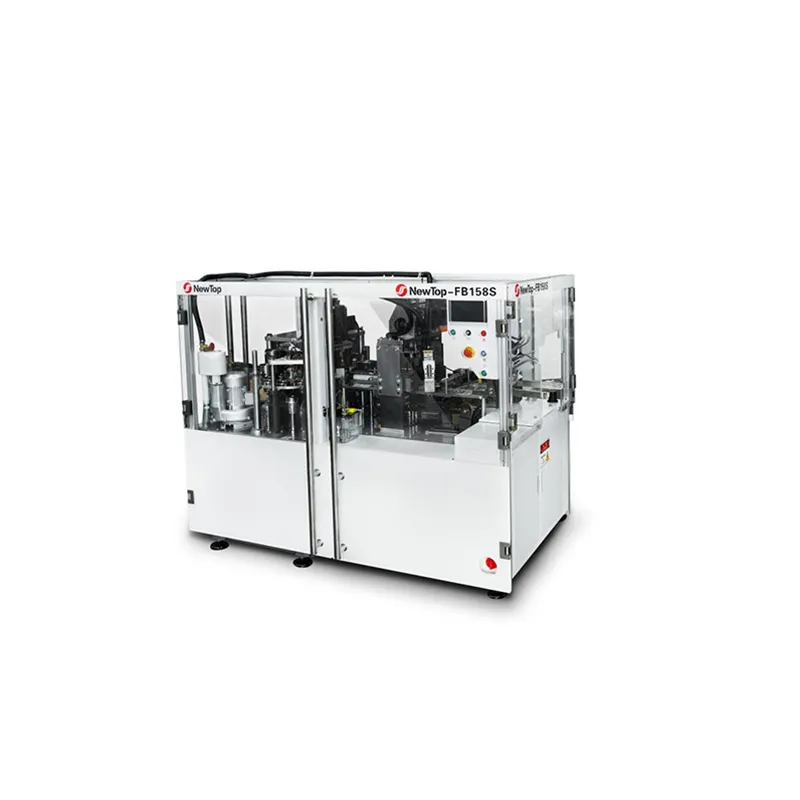
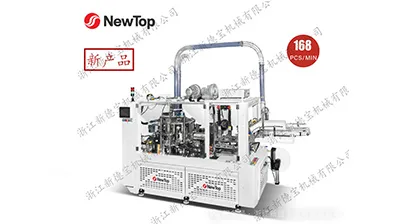
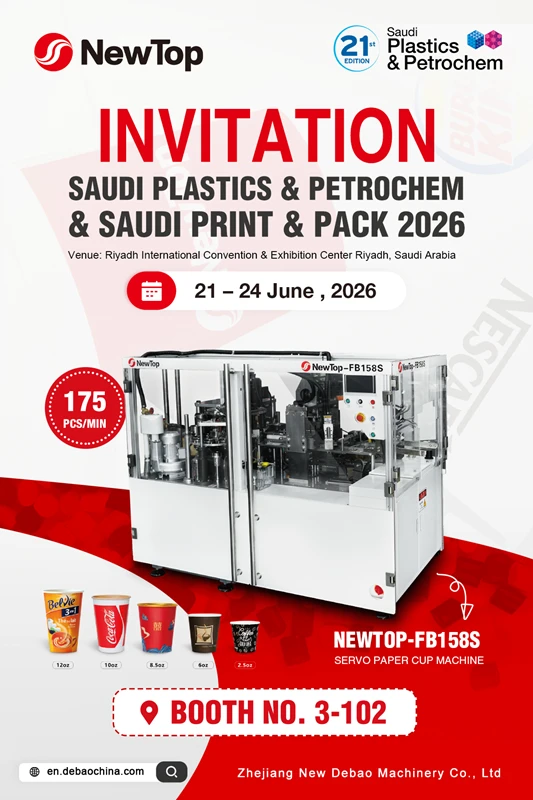
2.5oz-12oz Paper Cup Size
175 pcs/min Max Capacity
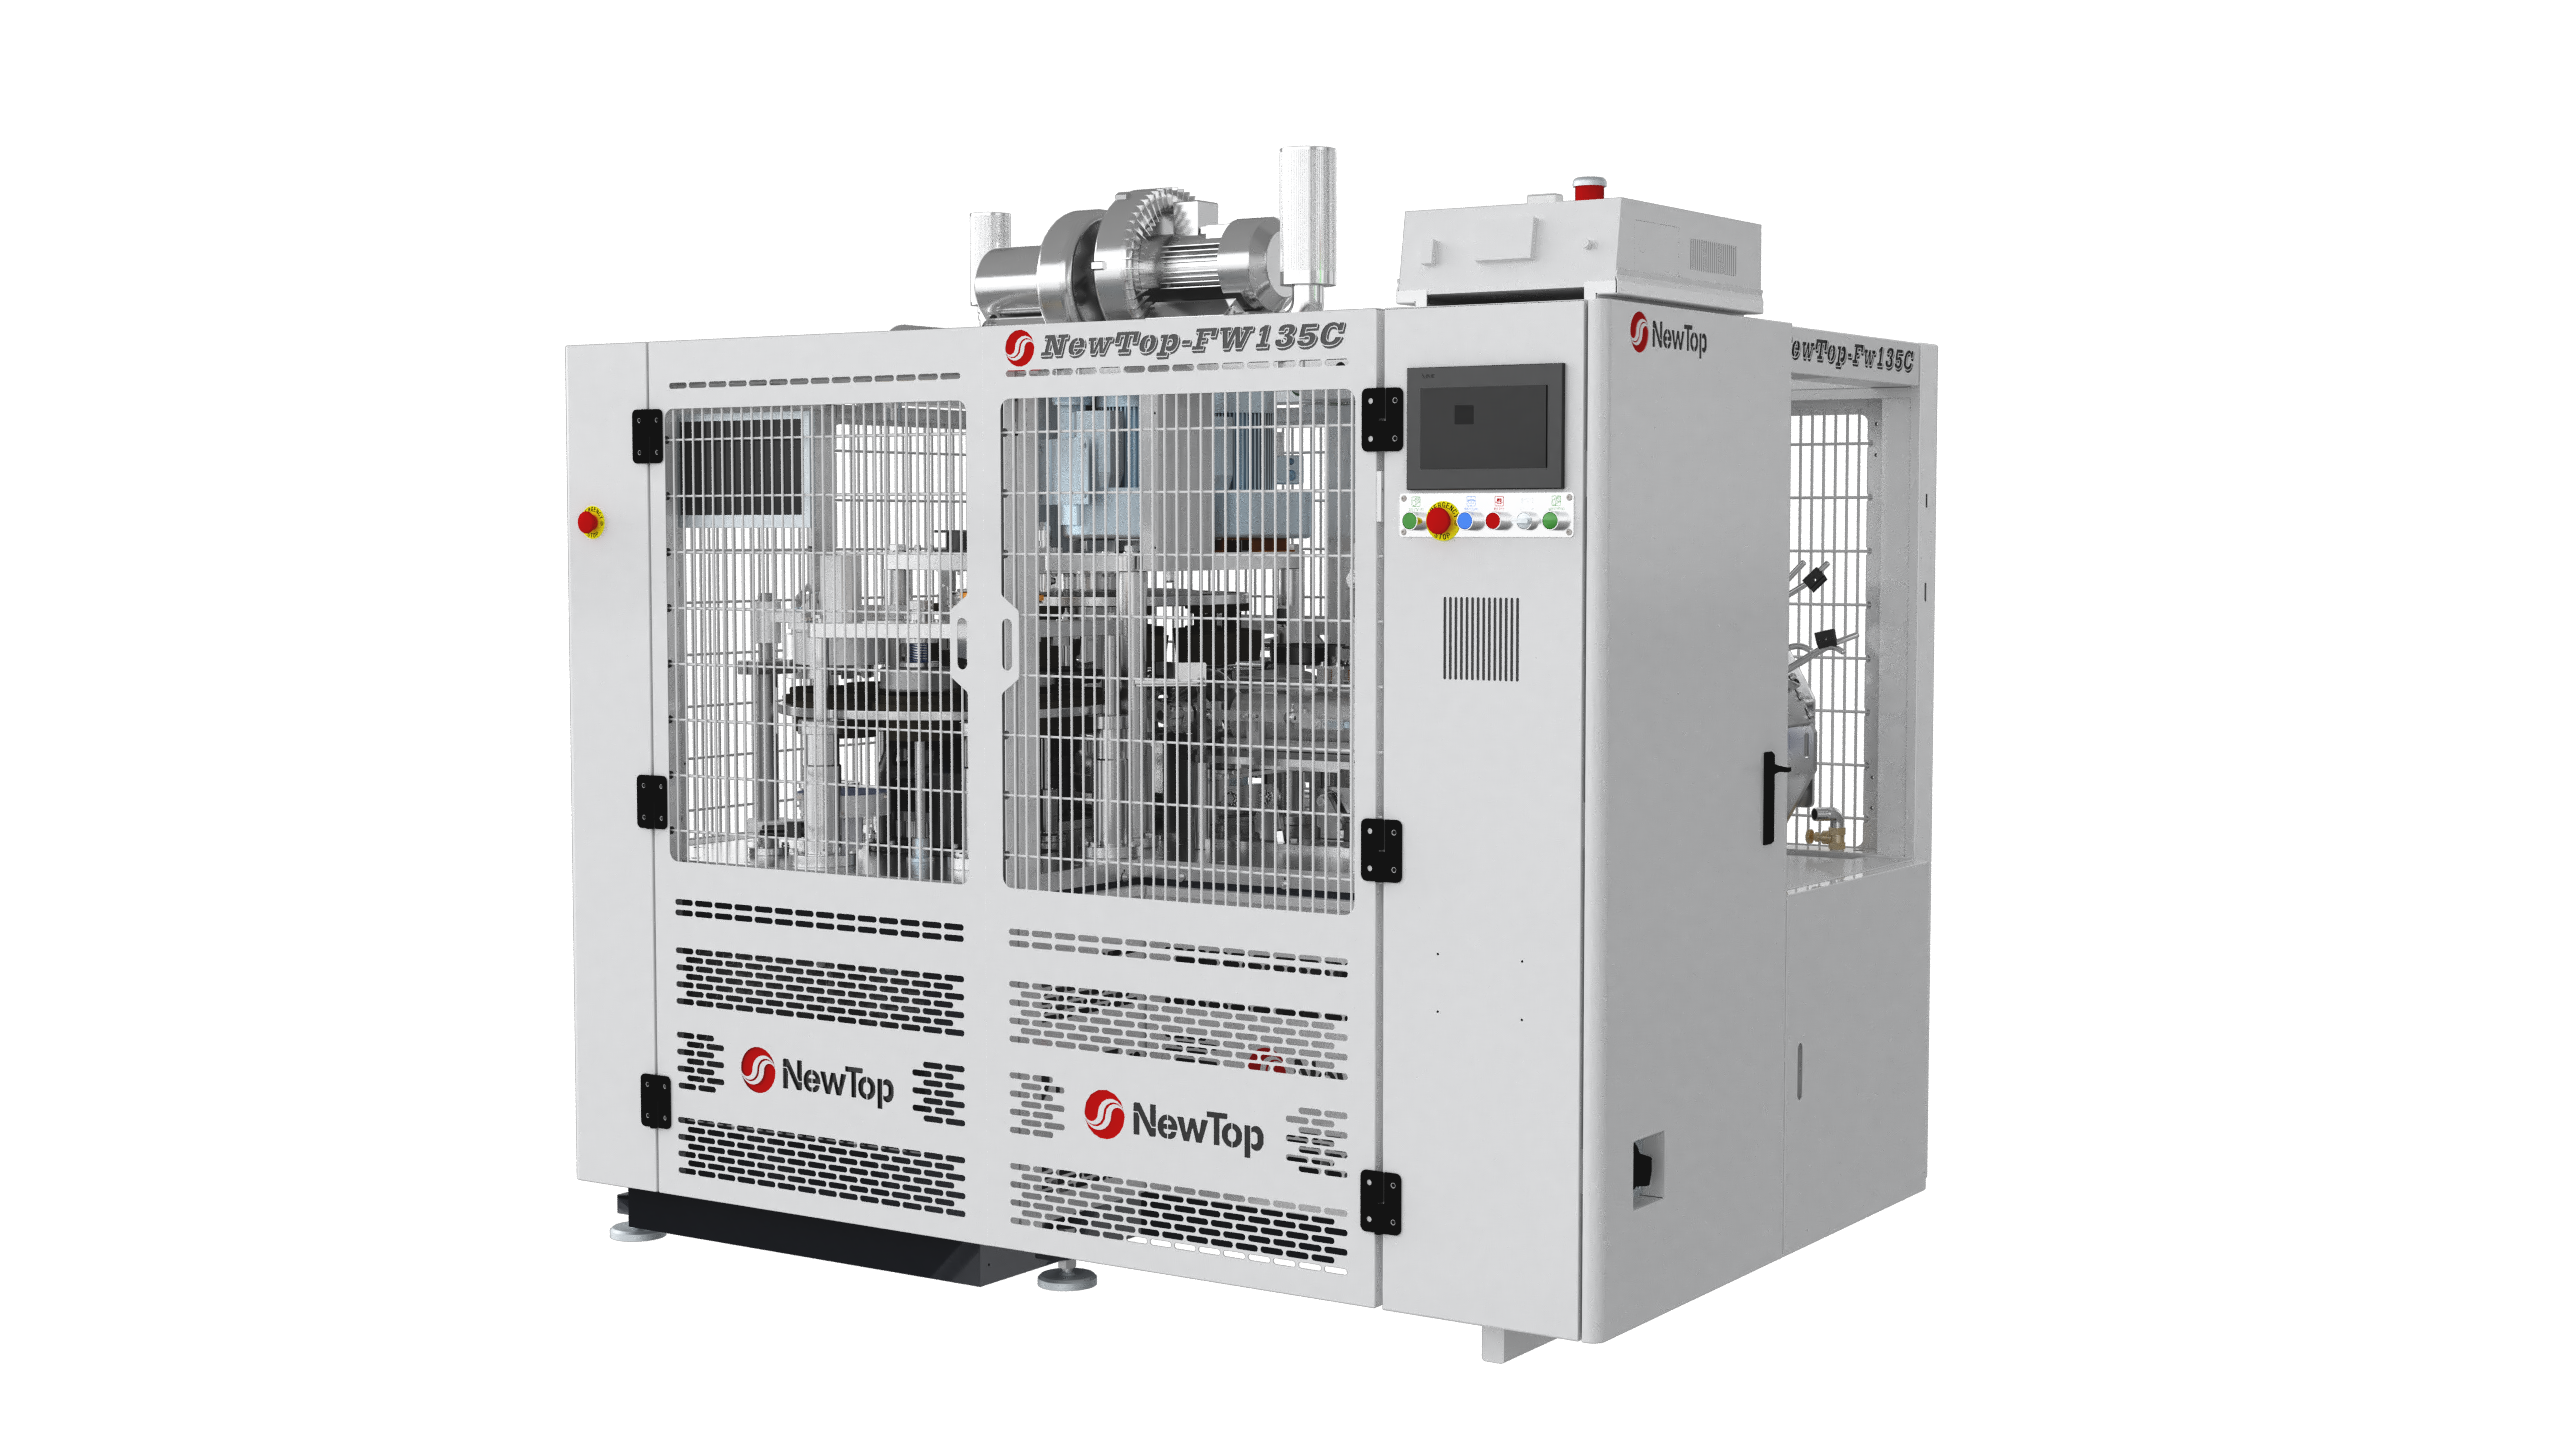
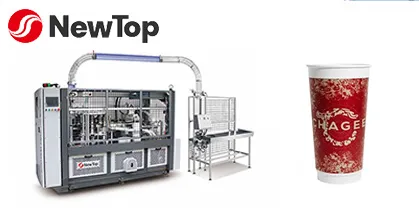
16-42oz Paper Cup Size
140 pcs/min Max Capacity
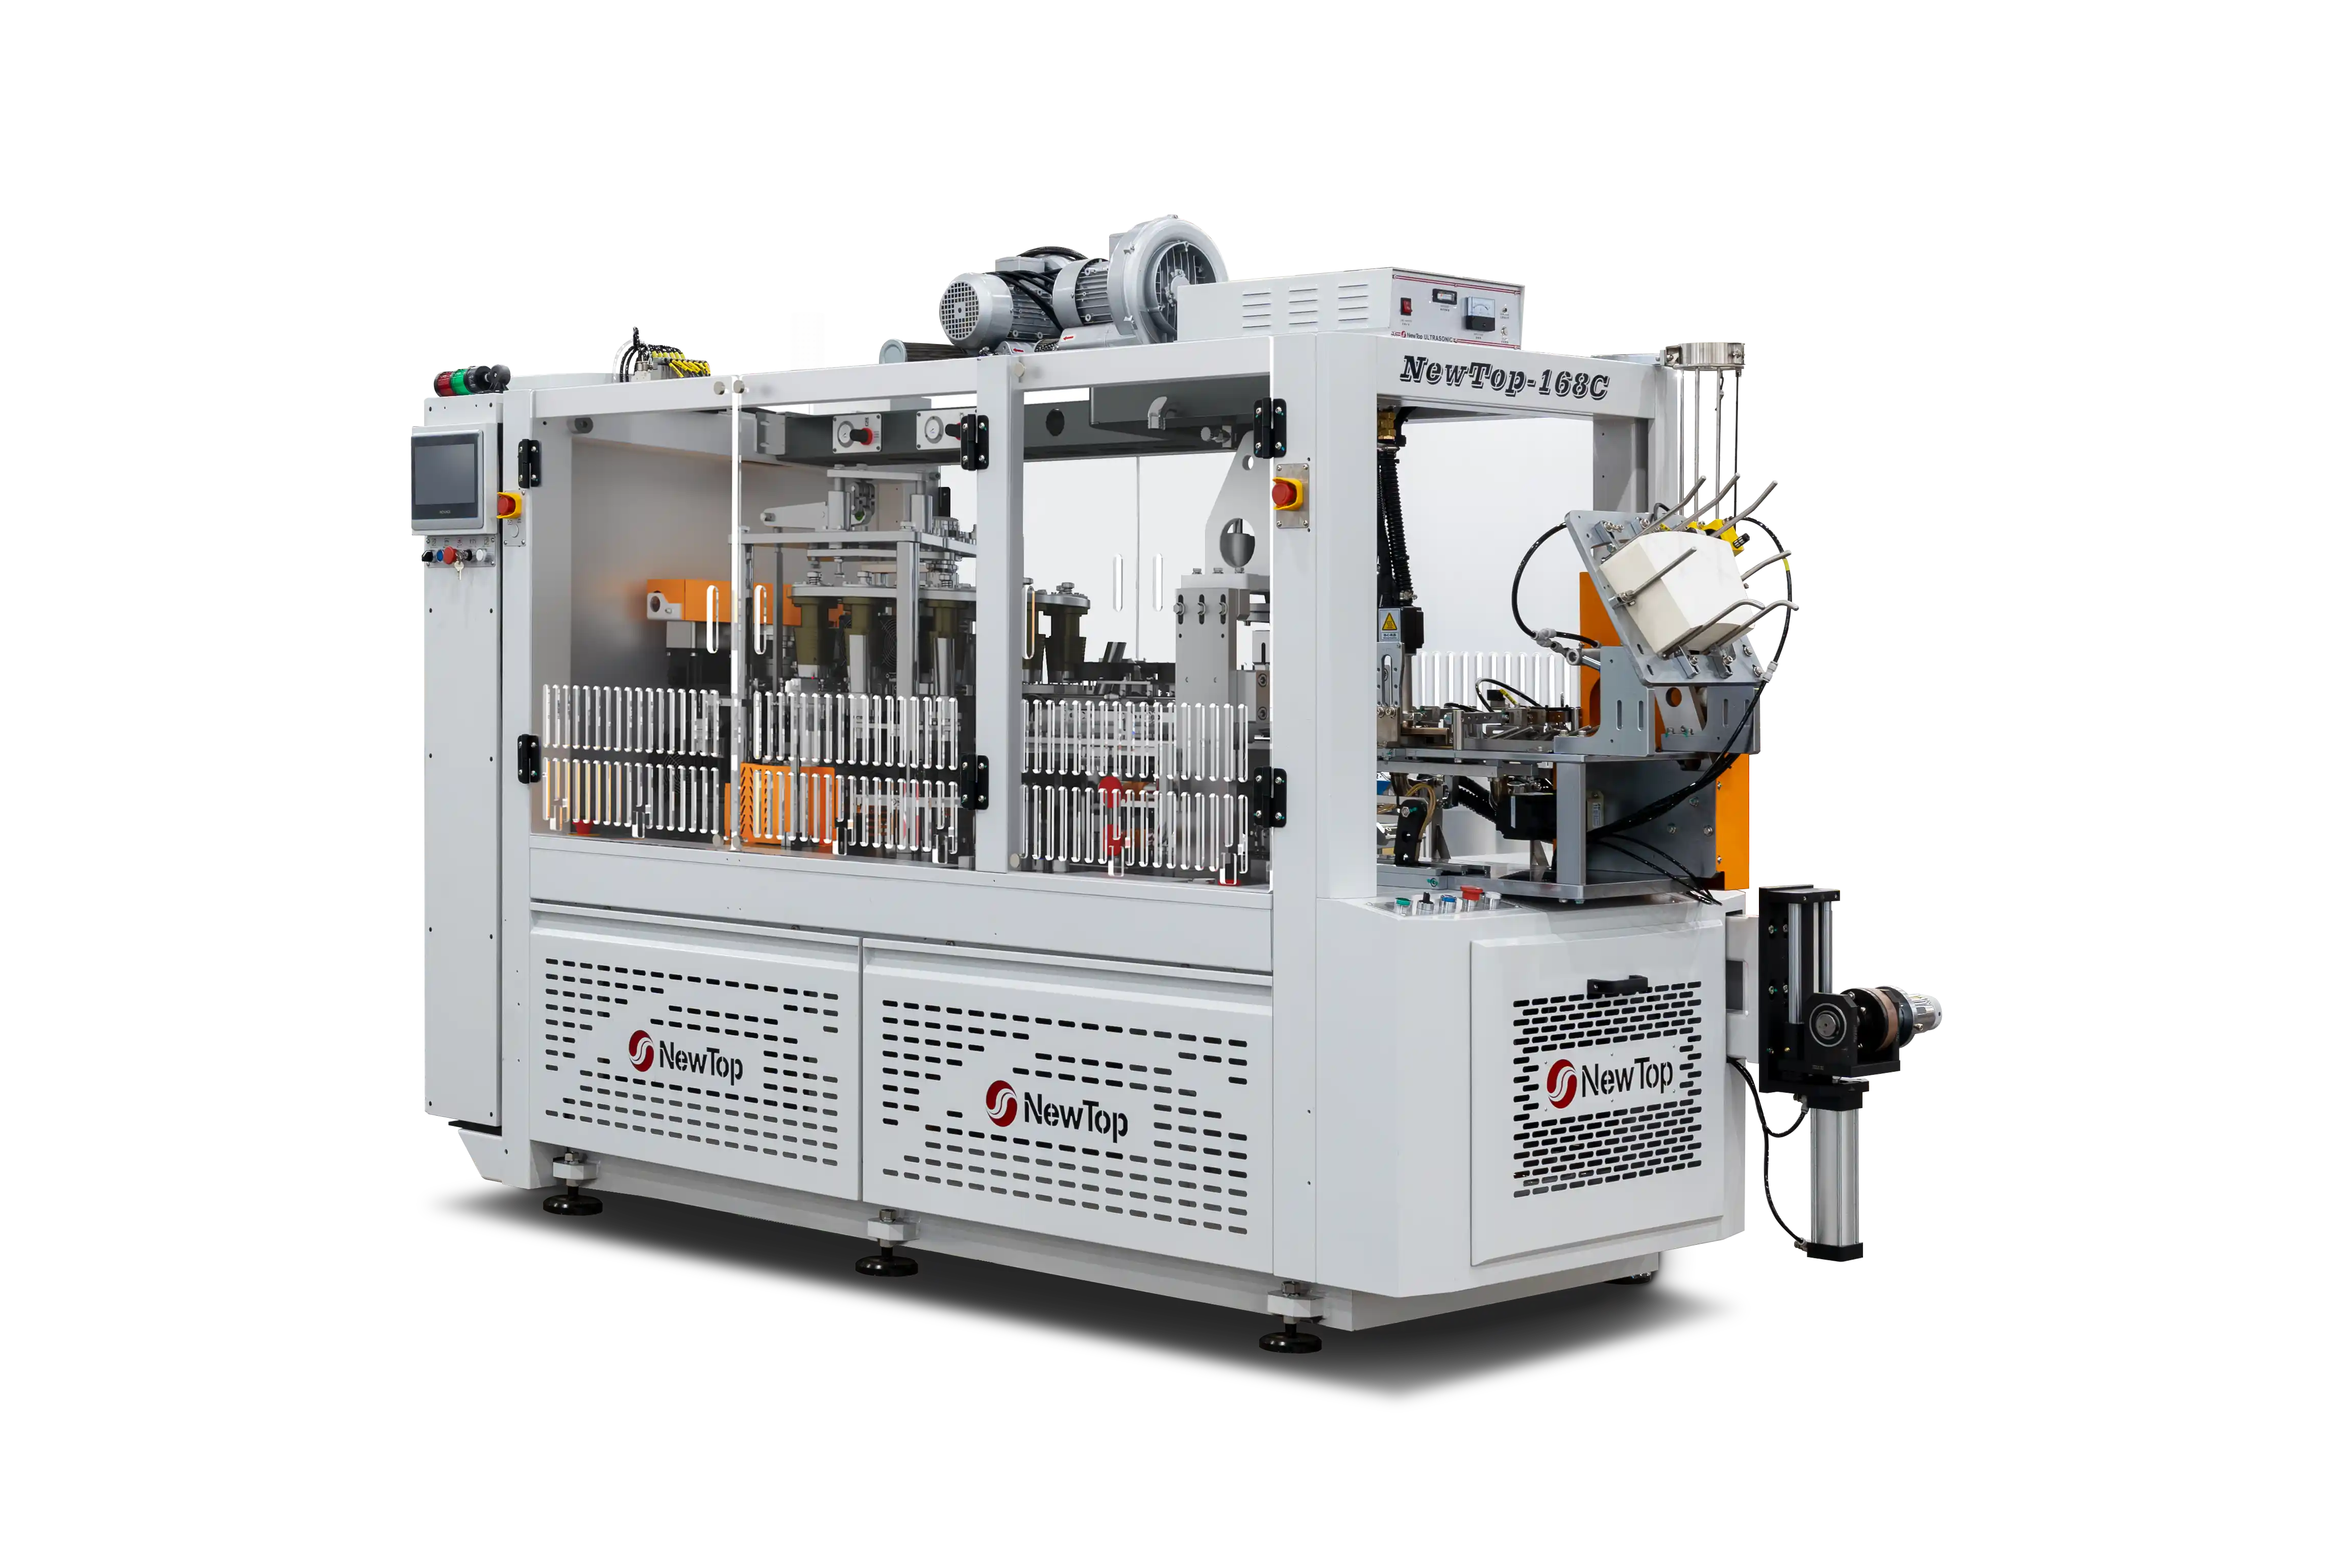
16-22oz Paper Cup Size
138 pcs/min Max Capacity

New Debao people pursue the concept of high quality and technology leading.
By changing the working mode with intelligent paper cup machine to make the operation more and more simple.
Fengzhai Natural Village,Wandu Village, Wanquan Town, Pingyang County, Zhejiang Province,China