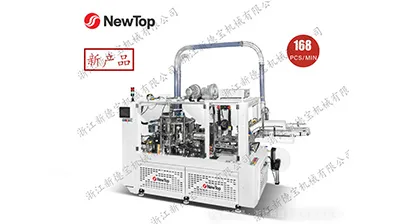

NewTop people pursue the concept of high quality and technology leading.
By changing the working mode with intelligent paper cup machine to make the operation more and more simple.

A machine rated at 80 bowls per minute does not deliver 80 bowls per minute across a shift. It delivers 80 only during the moments when nothing else interferes—and in large-format bowl production, many things interfere. Heating and cooling cycles lengthen, changeover between formats consumes hours, and the reject rate rises because a larger bottom joint has more area for a seal to fail. The gap between rated speed and actual output is where capacity plans go wrong, and it is wider in large-format bowls than in almost any other paper container format. This guide explains the factors that determine effective large-format bowl capacity, provides a calculation framework, and identifies where the largest losses typically occur. For the complete forming and quality context behind these capacity constraints, see the pillar guide on the Paper Bowl Manufacturing Process.
Rated cycles per minute (CPM) is a laboratory number. It describes what the machine can achieve under ideal material, ideal temperature stability, and uninterrupted operation. Real production subtracts from that number at several points, and the subtraction is larger for large-format bowls than for cups or small bowls.
Industry practice illustrates the scale of the gap. Throughput on paper bowl machines commonly drops 30–45% below rated CPM in real operations, with scheduled maintenance consuming roughly 15%, material and format changeovers consuming 8–20% per shift, and rejects from inconsistent raw stock consuming 5–12% of materials. A machine rated at 50 CPM with 85% uptime, 15% changeover time, and 7% defect rate yields approximately 2,015 usable units per hour rather than the theoretical 3,000.
For large-format bowls, each of these loss categories tends to be larger. The forming draw is deeper, so cycle time is intrinsically longer. The heating and cooling windows are wider, so temperature drift has more time to accumulate. And the bottom seal area is larger, so a small percentage of defective seals translates into a higher absolute number of rejected bowls.
The practical implication is that capacity planning for large-format bowls should start from effective output, not from the nameplate CPM. The table below summarizes the main loss categories and why they are larger in large-format production.
| Loss category | Typical range | Why large-format bowls are more exposed |
|---|---|---|
| Uptime loss | ~15% | Heavier tooling and deeper draws increase mechanical stress and jam clearance time |
| Changeover loss | 8–20% per shift | Large-format tooling is heavier; format changes between oz tiers take longer |
| Reject loss | 5–12% | Larger bottom area means more seal circumference where a defect can originate |
| Speed derating | Format-dependent | Stable speed at 70–170 oz typically falls to 60–80 pcs/min even on platforms rated higher for small formats |
If you are evaluating whether a machine platform can support a specific large-format output target, the Paper Bowl Machine series page shows how rated speed and format range are specified across different architectures.
Effective capacity is calculated by applying uptime, changeover, and reject rate sequentially to rated speed.
Effective Hourly Output = Rated CPM × 60 × Uptime % × (1 − Changeover %) × (1 − Defect Rate %)
This formula is not unique to bowls, but its inputs behave differently for large formats. The key is to populate each input with data from the actual format and material you intend to run, not with a generic assumption.
Step 1: Establish the rated CPM for the target format.
Do not use the maximum rated speed for the machine family. Use the speed the platform can sustain at the target bowl size. A platform rated at 180 pcs/min for 11–43 oz may run at 80–115 pcs/min for 30–170 oz formats, because the forming draw and heating cycle are longer. Published large-format ranges cluster around 60–80 pcs/min for 70–170 oz bowls, with some platforms reaching 80 pcs/min on lighter formats but dropping to 60–70 pcs/min on heavier stock.
Step 2: Apply an uptime factor.
Uptime reflects planned and unplanned stops. Scheduled maintenance, jam clearance, and minor adjustments all reduce available run time. A realistic starting assumption for a well-maintained line is 80–85%; a line with frequent material or sealing issues may run lower.
Step 3: Apply a changeover factor.
Changeover includes tooling swaps, parameter resets, and first-article validation. The loss is expressed as the proportion of available production time consumed by changeover. If a plant runs three large-format sizes per week and each changeover takes 2–4 hours, the cumulative loss can exceed 10% of the weekly production window.
Step 4: Apply a reject-rate factor.
Reject rate should be measured at the target format and material, not borrowed from a smaller-format benchmark. Large-format bowls are more sensitive to bottom-seal variation because the sealing joint is wider and any temperature gradient across the die produces an asymmetric bond. Defect rates in container forming have been documented to range from near zero to 40% depending on material and machine settings, which is why the reject input should come from trial data rather than a generic assumption.
Step 5: Validate against OEE.
Overall Equipment Effectiveness (OEE) combines availability, performance, and quality into a single metric. Published studies on paper container lines report average OEE in the range of roughly 55% to 77%, with the widely cited world-class reference at 85%. If your calculated effective output implies an OEE far above the published range for the format, one of the input assumptions is too optimistic.
Understanding the categories is not the same as knowing which one dominates. In large-format bowl production, three losses tend to account for the majority of the gap between rated and actual output.
Loss 1: The speed–format trade-off. Large-format bowls cannot run at small-format speeds because the physics of the forming cycle changes. The deeper draw requires longer heating and cooling, and the larger bottom area requires more consistent pressure over a wider joint. This is not a machine limitation in the abstract; it is a physical constraint that any capacity plan must accept. A platform that produces 180 bowls per minute at 16 oz will not produce 180 bowls per minute at 120 oz.
Loss 2: Changeover time per format tier. Large-format tooling is heavier and more sensitive to alignment than small-format tooling. A changeover that takes 30 minutes on a small bowl may take considerably longer on a large format because the bottom die and side-wall mandrel must be re-aligned to tighter tolerances. If the production plan requires frequent switching between large formats, changeover can become the dominant capacity constraint—not the forming speed.
Loss 3: Reject concentration at the bottom seal. Large-format bowls reject disproportionately at the bottom joint. The BioResources forming research documented that side seam buckling near the bottom fold can occur when bottom forming tool fit is incorrect, subjecting the seam to shear while it is still hot. In large-format bowls, the bottom joint carries a heavier fill load and the side wall is shallower, so the same mechanism produces a higher proportion of leaks. Automated optical inspection systems can detect internal, external, and bottom defects with accuracy rates above 99% on production lines, which means the reject rate is measurable—but inspection does not eliminate the capacity loss; it only makes the loss visible.
Scenario 1: A catering supplier planning a 64 oz line. A manufacturer currently running 16–32 oz takeaway bowls wants to add a 64 oz catering format on the same platform. The rated speed at 64 oz is lower than at 16 oz, but the more important question is how much lower. A realistic planning exercise uses trial data at the target format, applies an uptime assumption consistent with heavier tooling, and includes changeover time for switching between the takeaway and catering formats several times per week. If the calculated effective output falls short of the demand forecast, the gap is a format-speed reality, not a machine defect. For a closer look at how large-format bowl production is supported in practice, the page on the high-speed large-format bowl forming configuration describes the architecture used for 30–170 oz formats.
Scenario 2: A plant with high changeover frequency and low visibility. A supplier running four large-format bowl sizes across a week finds that the machine log shows peak speeds of 65 bowls per minute, but the average floor output is under 40. The gap is not caused by the machine’s rated speed; it is caused by frequent stops, uneven stacking, and jam clearance. Research on bowl production lines has shown that a machine running at 65 but jamming every 15 minutes delivers less usable product than a slower machine that stays running. In this scenario, the capacity plan should model interruption frequency as a first-class input, not as a residual uptime assumption. For a view of how inspection and packing stages affect overall line availability, the Bowl Machine Online Solution overview describes the in-line configuration from forming through finished product handling.
Once you have established the effective output for your target large format—using format-specific speed, a realistic uptime assumption, a measured changeover factor, and a reject rate from trial data—the next step is to compare how different machine architectures support that output over a full production cycle. Rated speed is one input; interruption frequency, tooling accessibility, and the stability of the sealing parameters at the target format are equally important. Contact Us
Paper Bowl Manufacturing Process: Forming, Capacity and Quality
Solved: Common Bottlenecks in High-Volume Paper Cup Production
Paper Cup Defects: Rim Curling, Side Seam and Bottom Knurling
This article is part of NewTop’s technical content library. No direct sales or pricing information is included. All technical discussions aim to help you make informed purchasing decisions.
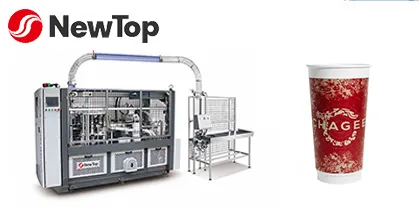
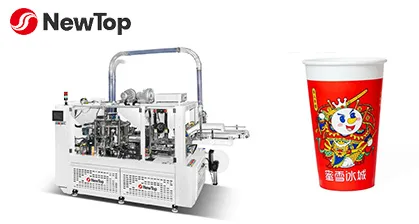
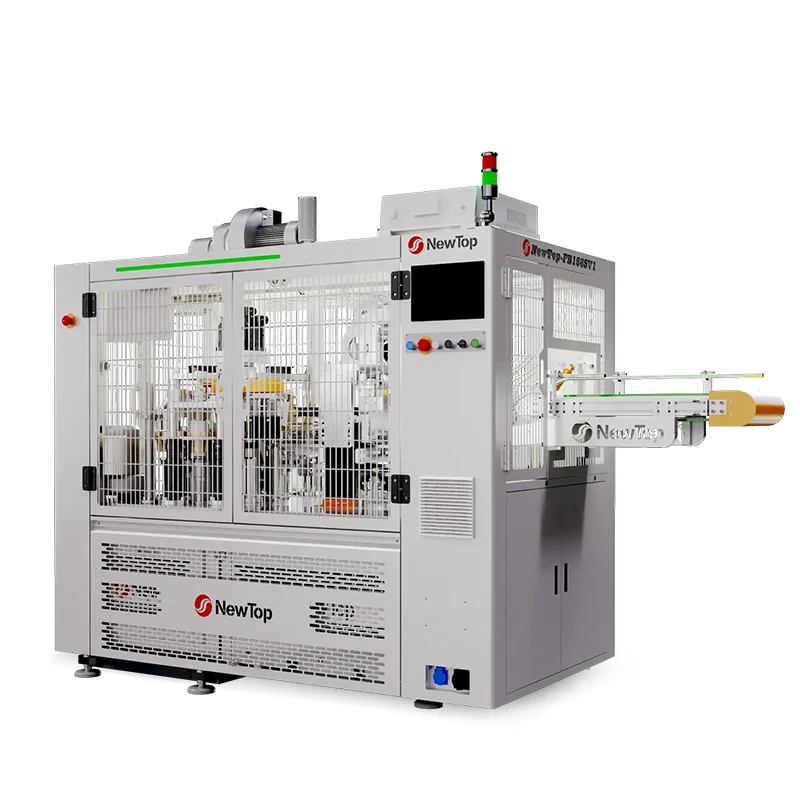
2.5oz-12oz Paper Cup Size
168-175 pcs/min Max Capacity
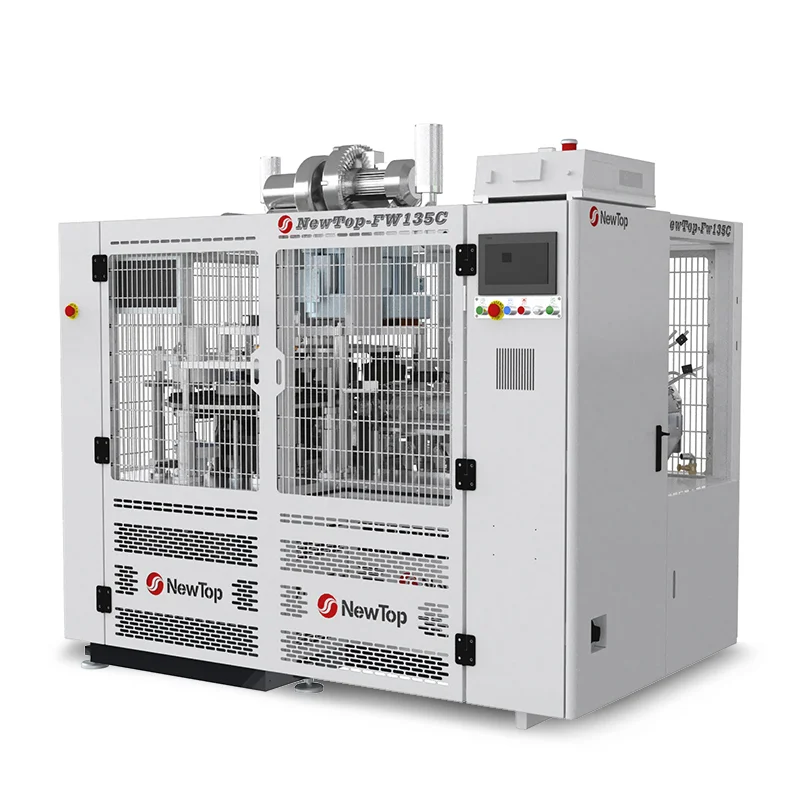
16-42oz Paper Cup Size
140 pcs/min Max Capacity
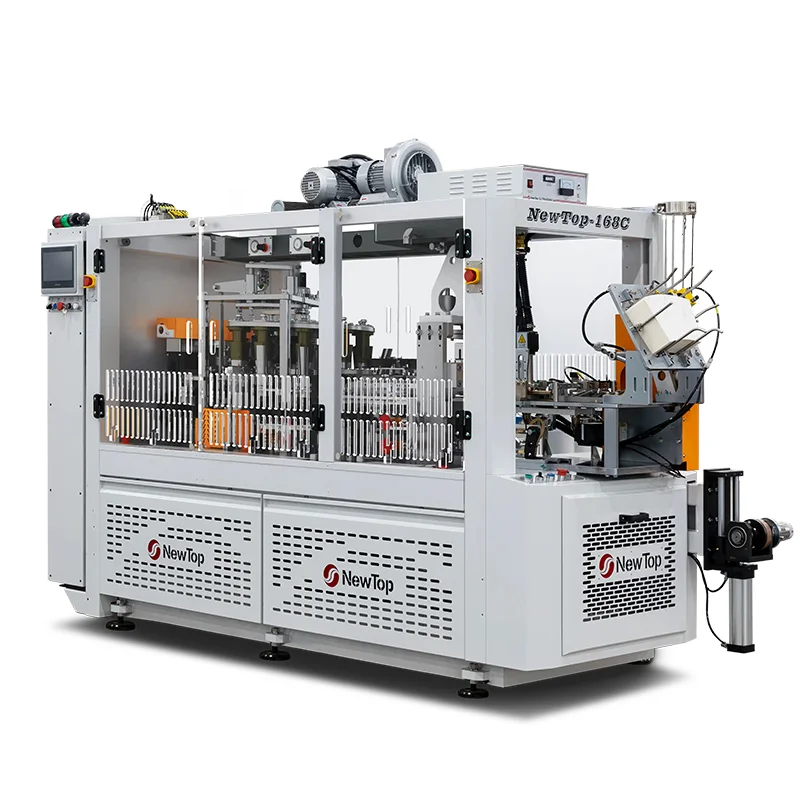
16-22oz Paper Cup Size
138 pcs/min Max Capacity




NewTop people pursue the concept of high quality and technology leading.
By changing the working mode with intelligent paper cup machine to make the operation more and more simple.
Fengzhai Natural Village,Wandu Village, Wanquan Town, Pingyang County, Zhejiang Province,China